
Defensible Decisions: A Pragmatic Framework for Engineering Choices

Engineering teams frequently face complex challenges, with multiple viable options that create unclear paths forward. Projects can stall when participants view these options through different lenses and champion solutions based on conflicting assumptions. The core problem is the absence of a system to untangle this web of perspectives. Options are often not evaluated correctly because of a failure to understand one another's point of view. These assumptions must be made explicit, to align the team around shared objectives and enable a structured analysis of competing options.
Consider the most frequent method to compare options against each other: pros and cons lists. These lists often duplicate information (a “pro” for one option is simply a “con” for another). They often fail to force a complete evaluation of each option against every critical factor, allowing glaring omissions to go unnoticed.
The Problem
We need a system that forces an explicit entry for each option of each metric value, and a notion of which pros are most important and which ones are least important. Unlike a simple list, such a system would highlight where information is missing and force the rigorous data collection needed for a truly informed decision.
The Solution: The Decision Matrix
The Decision Matrix is a system that externalizes this process. It's a tool designed to structure evaluation, quantify trade-offs where possible, and ensure that every proposed solution is assessed against the same prioritized criteria. This has a positive collaborative effect, as proponents of different viewpoints must work together to fill out the matrix and, in doing so, understand one another’s perspectives. It transforms a subjective debate into a methodical, systems-based analysis.
I’ve taken a few liberties with terminology. As we’ll see, the Decision Matrix is technically only one part of the Decision Document, and even that is only an artifact rather than a full mechanism. So it doesn’t meet the strict criteria of our prior Mechanisms post. Think of this as a “one-shot” mechanism for making a decision.
The Decision Matrix vs. the Weighted Numerical Scoring Method
Before we proceed, I’d like to differentiate the decision matrix I’ll discuss in this post from a common version that you may have already seen: the weighted numerical scoring method. This frequently used anti-pattern assigns a weighted value to each metric and sums them to find a "winner." This practice should be avoided entirely. It encourages gaming the system by adding low-priority metrics to inflate a favored option's total and distracts from the primary purpose of the matrix, which is to facilitate a high-quality discussion about trade-offs.
The optimal tool will be a springboard for conversation, not a calculator. Hiding the nuance of each metric behind an abstract, potentially biased number is an acknowledgment of not fully understanding the details and abandoning the entire decision to a formula.
The Anatomy of a Decision Document
A robust decision matrix is more than just a table; it's part of a complete document designed for clarity and alignment. A complete decision document is composed of five parts:
The Problem Statement and Constraints: This is the most important part of the document. This clear, explicit section frames the exercise. It formally states the decision, defines the objective, and lists hard, non-negotiable constraints (e.g., budget, timeline, required certifications). Without a shared understanding of the problem, participants may optimize for the wrong outcomes and fail to solve for the same set of constraints.
Solution Space: Next is an outline of each option; that is, a brief, neutral description of each alternative being considered should appear before the matrix. Avoid personal labels (e.g., "Alice's plan"). Instead, use technical descriptions like "In-memory cache option" to keep the focus on the solution, not the person.
The Decision Matrix: This is the core table that allows options to be evaluated. The options form the columns and the evaluation metrics form the rows. This orientation is standard because there are typically far more metrics to consider than available options. Each cell in the grid should be populated with data, not a subjective judgment. The ideal table uses a direct quantitative value (e.g., price in dollars, time in minutes, memory in gigabytes). For truly subjective metrics that cannot be easily quantified (like "ease of use"), a low-resolution scale (e.g., 1–5, where 1 is always most desirable) can be used as a fallback, but this should be applied sparingly.
Recommendation: This section immediately follows the decision matrix. The reader will not need to drill into the metric details if the recommendation is sufficiently clear.
Metric Descriptions: Following the matrix, provide a sentence or two describing each metric in detail. A short phrase in a table, like "Deployment Complexity," can have multiple interpretations. This section ensures all participants are evaluating based on a shared definition, which is critical for alignment.
Case Study: An Ineffective vs. Effective Decision Matrix
To illustrate this process, I’ll use an example from my personal life (choosing a new car), as I cannot share details from proprietary projects. The framework for this example, however, is identical to the one I deploy in professional engineering contexts.
An Ineffective Decision Matrix
An ineffective matrix, full of anti-patterns, might look like this:
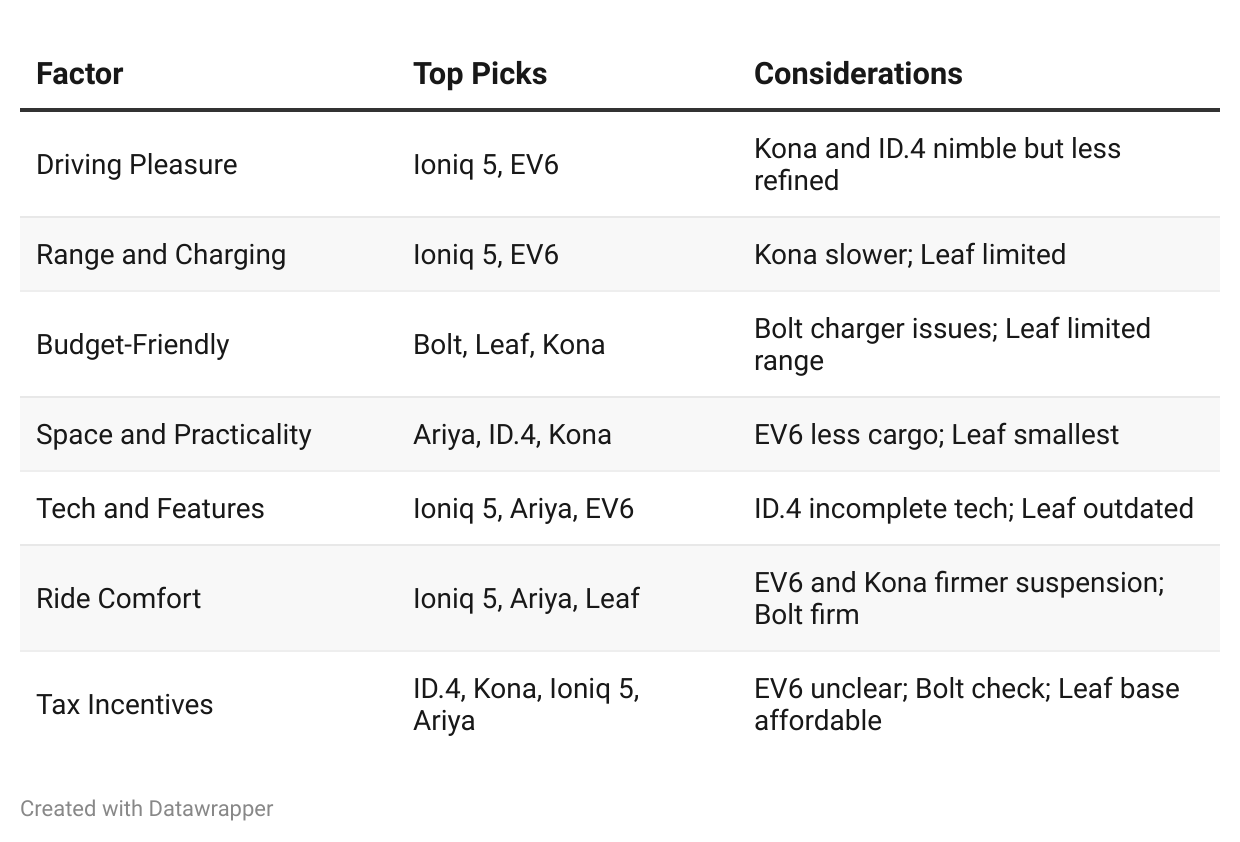
This matrix is a collection of subjective judgments that makes it impossible to compare trade-offs systematically. Now, let's apply our structured framework to the same problem.
An Effective Decision Matrix
1. Problem Statement
Our goal is to choose the best electric vehicle for a daily commuter who prioritizes affordability, range, and charging time. A hard constraint is that the vehicle must be able to fit two hockey bags without lowering the back seats. The available charging network is less important as it will be used for city driving and most often be charged at home; however, fast charge is moderately important in case of schedule changes. Because of the short trips that will be taken in this car, ride comfort and driving enjoyment are not important. The commuter prefers to avoid Teslas.
2. Solution Space
The options are non-luxury electric vehicles that are readily available in the United States: Kona SEL, ID.4 Pro, Ioniq 5 SEL, Bolt 2LT, EV6 Wind AWD, Nissan Ariya Venture+, and Leaf SV+.
3. Decision Matrix
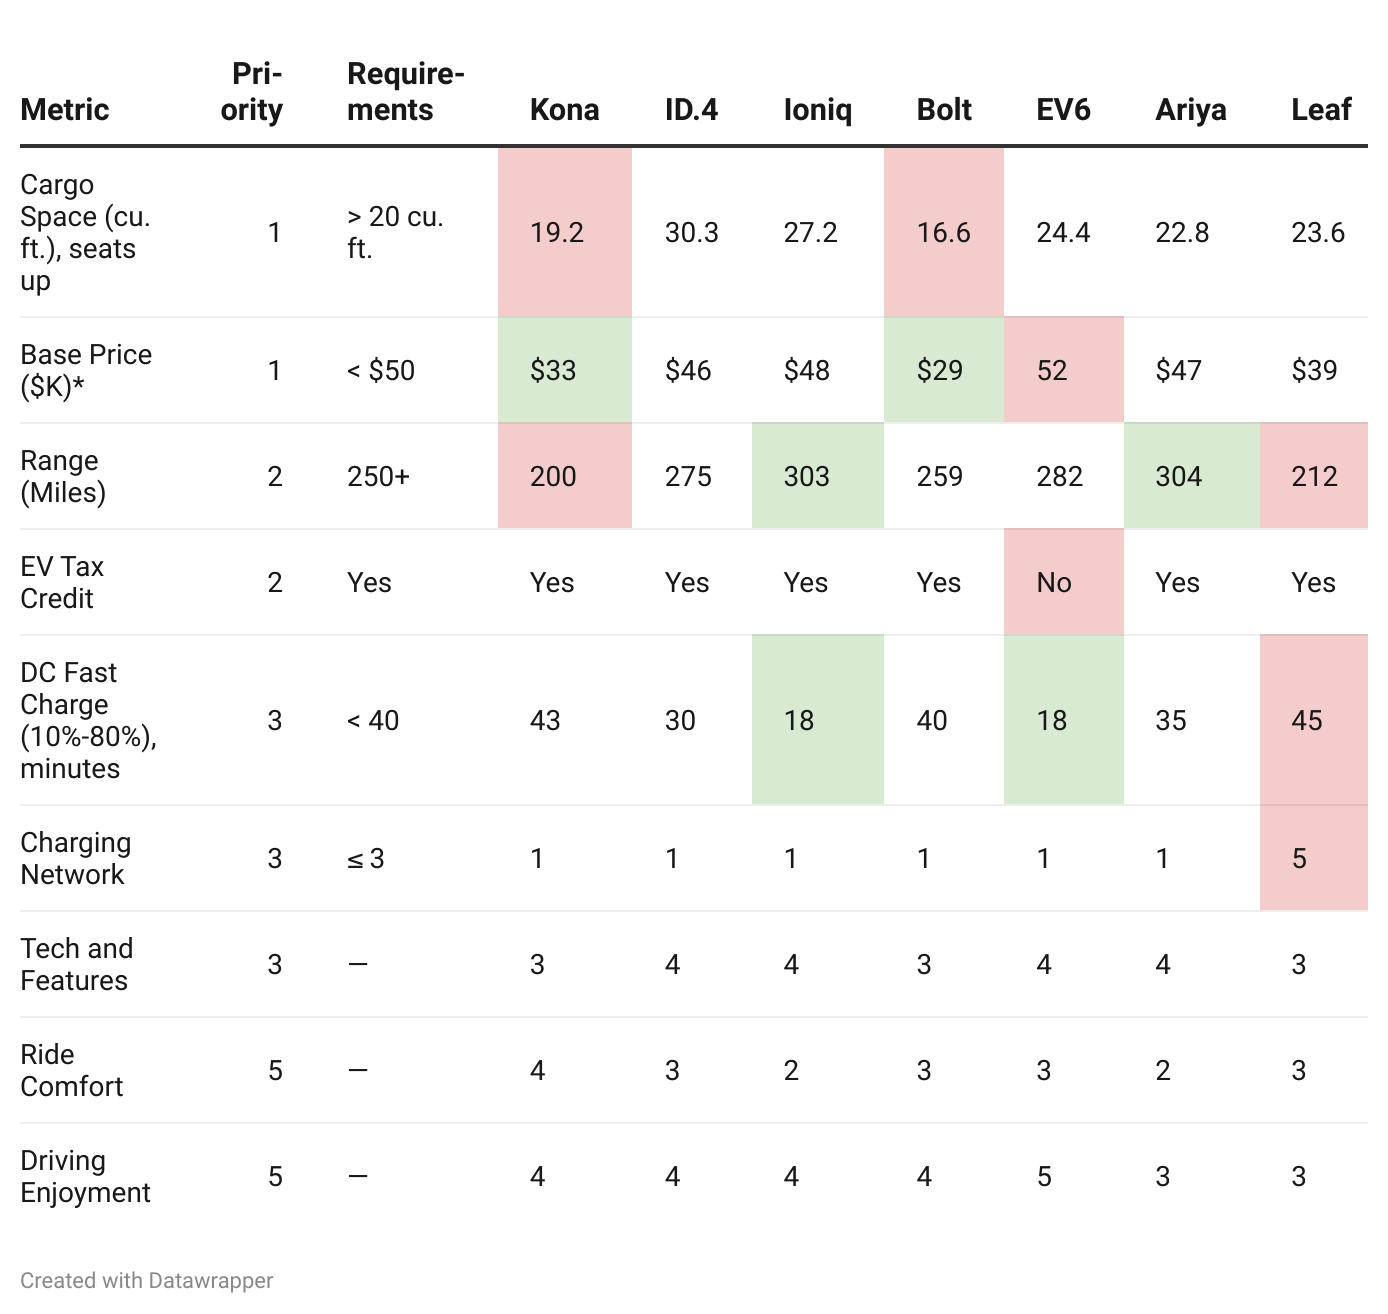
*Prices are rounded to the nearest thousand.
4. Recommendation
The initial downselection is to the ID4, Ioniq, and Ariya, as they all meet the requirements. The Ioniq offers comparable price and the fastest charging of the three finalists, so it is the recommended option.
5. Metric Discussion
Most metrics are clear with one exception:
Charging Network. Most carmakers have started supplying NACS adapters to allow access to Tesla superchargers. Leaf is limited to the CHAdeMO standard.
Analysis
This structured approach makes problematic options immediately apparent. The Kona and Leaf, for instance, fail the hockey bag constraint. The EV6 fails the tax requirement, although that constraint could be folded into an “effective” purchase price. In any case, the EV6 is already the most expensive, so the tax constraint is irrelevant.
The decision can now include a rich, data-informed discussion about the trade-offs among the viable options.
Personal Postscript
Our family purchased the Ioniq and have been very happy with it.

Applying the Decision Matrix in a Team Setting
Although the Decision Matrix provides a robust framework for individual analysis, its value is dramatically magnified when used in a team setting.
How to Harness the Matrix Collaboratively
Involve the Team in Metric Selection and Weighting: This fosters ownership and ensures that the metrics reflect the team's collective understanding of priorities.
Encourage Open Discussion and Debate: The process should enable healthy debate about the relative importance of metrics and the performance of different options.
Include All Metrics, Even If They Seem Minor: Even if a metric seems unnecessary, including everyone’s suggestions can be valuable. When the metrics are prioritized, the unnecessary ones will naturally fall to the bottom, as in a risk register. This acknowledges everyone’s perspective while providing a clear demonstration of where their metric ranks in relation to others, which fosters understanding.
Use the Matrix as a Communication Tool: The completed Decision Matrix provides a clear and transparent record of how the decision was reached, which can be invaluable for communicating the rationale to stakeholders.
The Decision Matrix’s success in a team setting hinges on two factors:
Unbiased, Objective Metrics: These metrics must be directly relevant to project goals. This rigorous approach prevents skewed evaluations and forms the objective basis for collaborative decisions.
Unbiased Facilitator: In contentious decisions, a skilled guide is required to lead the priority-setting discussion, challenge biased data, and keep the conversation focused on the most critical trade-offs. This role can be assumed by the engineering manager or a designated team lead as long as they are not the proponent of one of the options.
Contrarian to Collaborative
The Decision Matrix is a unique way to transform disagreements into constructive collaboration. By using the Decision Matrix to externalize perspectives and force a data-driven discussion, individuals or teams with divergent viewpoints can come to a shared understanding and create an optimal solution.
Aligning Opposing Engineers: On several occasions, I have assigned two engineers with strong opposing ideas to compile a decision matrix together. The right option emerged fairly quickly, and the individual initially holding the suboptimal idea was often glad they didn't steer the team in the wrong direction. This approach proved effective within teams composed of generally cooperative engineers.
Resolving Interteam Disagreements: In a previous role, my vice president asked two teams that could not agree on a way forward to present a decision document. After many conversations, they ended up extending the decision matrix to highlight areas of disagreement by adding two entries, each annotated by the team that held that view. The exercise served to clearly delineate the metrics on which the teams agreed and disagreed to the VP, who was then able to guide the decision.
6 Steps to Using this Framework in Practice
Once the foundational principles of the Decision Matrix are understood, the next step is systematic deployment. Here are six steps to integrate this framework into your team’s workflow.
Start Early: Hold a kickoff meeting with stakeholders before design options are finalized. The goal is to identify and prioritize the key metrics early. This can surface hard constraints (like cost or schedule from a risk register) that might eliminate certain paths from consideration entirely.
Collect Priorities in Advance: Ask team members to privately assign a priority level to each metric. Discussing any mismatches is a valuable exercise, as misalignment often reveals differing underlying assumptions about the project's goals.
Keep the Option Space Broad. Avoid making assumptions about the "best" solution too early in the process. Keep an open mind and explore a range of options before diving into detailed analysis.
Collaborate on Filling the Matrix: Assign team members to research and fill the cells. When two people disagree on an option, having them fill out the matrix together is a powerful mechanism for mutual education and alignment.
Consider a Hybrid Option: When two competing solutions are both promising, make an effort to create a third hybrid option that combines their respective strengths. The process of building the matrix often reveals opportunities for such synthesis.
Facilitate the Discussion: Use the completed document to guide the final decision-making meeting. Focus the conversation on the high-priority metrics and the most significant trade-offs that the data has illuminated. The matrix has done its job by structuring the conversation and making it productive.
Appendix: Best Practices
Here is a collection of critiques and suggestions I have offered over multiple iterations of decision matrices. They might have disrupted the information flow, but can be quite important, so I am summarizing them here as a set of best practices.
Metric Selection
Focus on and Describe the “Why”: Throughout the decision-making process, consistently focus on and clearly articulate the underlying "why." This means defining metrics based on essential project needs. For example, framing a metric as "real-time performance" or "library ecosystem breadth" instead of just entering “Java” or “Rust” exposes the underlying project need and enables a discussion of its priority. One sign that a metric needs more work is that it cannot be put on a qualitative or quantitative scale and is therefore only a descriptive label and not a true metric.
Use Quantifiable and Objective Metrics: Whenever possible, prioritize quantifiable and objective metrics over vague qualitative entries. These metrics provide a clear and measurable basis for comparison. For example, instead of a vague "commuting cost is high," use a specific metric like "driving time in peak traffic is 45 minutes." Notice that this example used “driving time” as the key pain point rather than an equally reasonable distance in miles, which can lead to creative ideas like “stagger the commute schedule to avoid peak traffic.”
Ensure Metrics Are Prioritized: While comprehensiveness is valuable, an excessive number of metrics can waste time and paralyze analysis. Ensure that metrics are ruthlessly prioritized, then sort and discuss them in order. If teams or individuals cannot agree on a priority, add a second column for “alternate priorities,” to honor both perspectives, and then continue reviewing.
Provide Actual Values, Not Just “Pass/Fail”: For any metric with a quantitative constraint (e.g., "Range ≥ 250 miles"), always provide the actual value (e.g., "275 miles" or "212 miles"). This allows the team to see how close an option is to the margin, which is critical for understanding trade-offs.
Information Presentation
Use Appropriate Precision: Rounding to a reasonable margin (e.g., nearest thousand for car prices) optimizes readability and helps readers focus on what truly matters. This is a specific instance of a general rule: Optimize the matrix for fast comprehension at a minor of unnecessary precision.
Use Consistent Directionality: If "high" is bad for cost, it should consistently be bad for other metrics where applicable. This small change eliminates cognitive switching.
Color Code Only Critical Cells: Some versions of decision matrices advocate coloring every cell, but it is more effective to color code only the cells that represent critical information or trade-offs.
Make It Fit on a Page. Scrolling around a large table or squinting to read a tiny font damages the reader’s ability to concentrate. Present the information on a single page.
Use Clear and Relevant Language: Ensure that the language used for metrics and descriptions is clear, relevant, and understandable to all stakeholders involved in the decision. Avoid jargon.